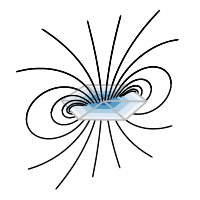
bfieldtools.viz.plot_3d_current_loops
-
bfieldtools.viz.plot_3d_current_loops(current_loops, colors='auto', figure=None, figsize=(800, 800), tube_radius=0.05, origin=array([0, 0, 0]))¶ Plot current loops (e.g. contour_polys given by scalar_contour()) in 3D using mayavi.
- Parameters
- current_loops: list of (N_verts, 3) arrays with length N_loops
List of segmented lines specifying the path of a current loop. Last vertex is assumed to be connected to the first.
- colors: ‘auto’ (default) or None or (3, ) tuple or list of (3, ) tuples with same length as current_loops
Optional specification of colors used for current direction. If auto (default), color blue-red based on current direction. If None, use middle-grey for all loops. If tuple, color all loops according to tuple. If list of tuples, color each loop accordingly.
- origin: array-like with length 3
Shifts the origin used to determine the ‘auto’ coloring.
- tune_radius: float
radius of loops plotted
- figure: existing mlab figure
Optional, if passed will plot to existing figure
- figsize: (x, y) tuple
Optional, if plotting to new figure specifies the size (in pixels)
- Returns
- fig: mlab figure
