Note
Go to the end to download the full example code.
Integrals testing
import pyvista as pv
from bfieldtools._example_plots import triangle_mesh, vector_glyphs, polyline

pv.set_plot_theme("document")


import numpy as np

import matplotlib.pyplot as plt

import trimesh
Test potential shape slightly above the surface %%
x = np.sin(np.pi / 6)
y = np.cos(np.pi / 6)
points = (
    np.array(
        [
            [0, 0, 0],
            [1, 0, 0],
            [x, y, 0],
            [-x, y, 0],
            [-1, 0, 0],
            [-x, -y, 0],
            [x, -y, 0],
        ]
    )
    * 2
)

tris = np.array([[0, 1, 2], [0, 2, 3], [0, 3, 4], [0, 4, 5], [0, 5, 6], [0, 6, 1]])
mesh = trimesh.Trimesh(points, tris)
scalars = np.zeros(7)
scalars[0] = 1
Linear dipole density %%
# Sign ok
points = np.array([[0.1, 1, 1], [0.1, 1, -1], [0.1, -1, -1], [0.1, -1, 1]]) * 2
# points = np.roll(points, 2, 1)
tris = np.array([[0, 1, 2], [2, 3, 0]])
mesh2 = trimesh.Trimesh(points, tris)
for ii in range(7):
    mesh2 = mesh2.subdivide()

from bfieldtools.legacy.integrals import triangle_potential_dipole_linear as t1
from bfieldtools.integrals import triangle_potential_dipole_linear as t2

RR = mesh2.vertices[:, None, None, :] - mesh.vertices[None, mesh.faces]
p1 = t1(RR, mesh.face_normals, mesh.area_faces, planar=False)
p2 = t2(RR, mesh.face_normals, mesh.area_faces)

assert np.allclose(p1, p2)


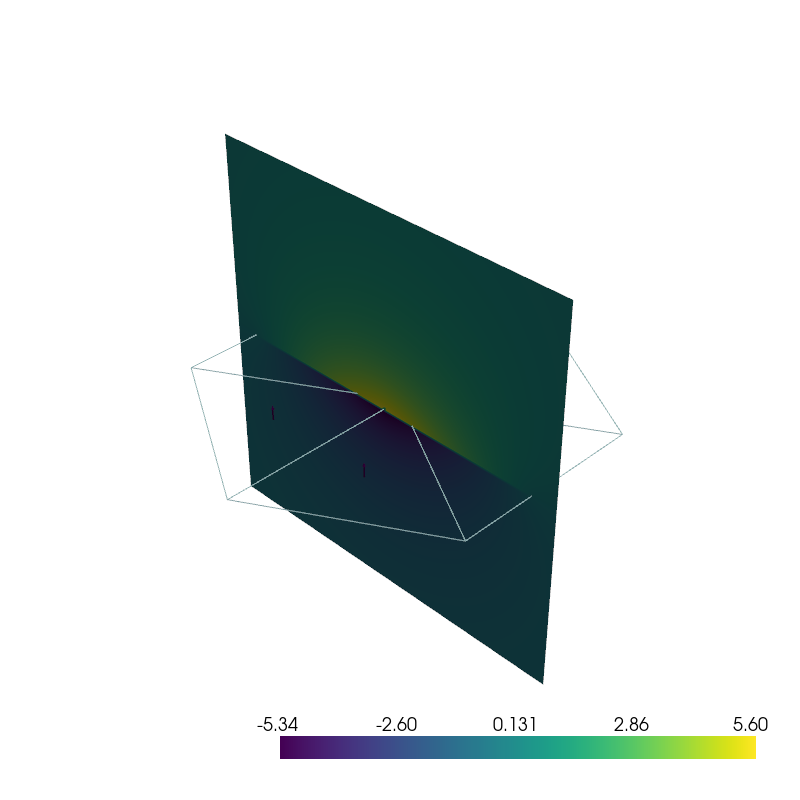
plotter = pv.Plotter(window_size=(800, 800))
plotter.add_mesh(
    triangle_mesh(*mesh2.vertices.T, mesh2.faces),
    scalars=p1[:, :, 0].sum(axis=1),
    show_scalar_bar=False,
)
plotter.add_scalar_bar()
plotter.add_mesh(
    triangle_mesh(*mesh.vertices.T, mesh.faces),
    style="wireframe",
    show_scalar_bar=False,
)
plotter.add_mesh(
    vector_glyphs(*mesh.triangles_center.T, *mesh.face_normals.T), show_scalar_bar=False
)

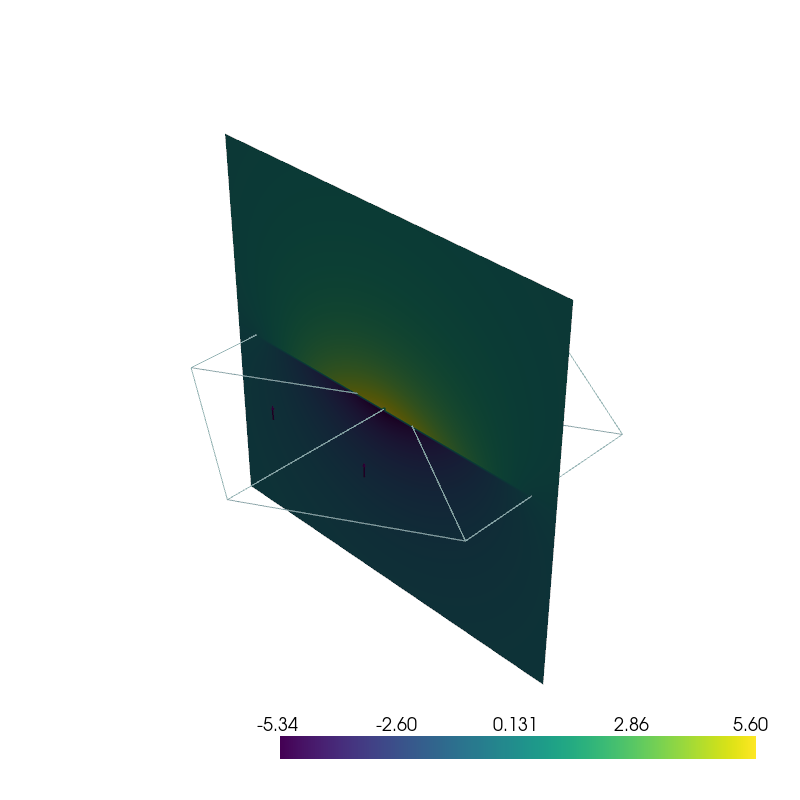
plotter = pv.Plotter(window_size=(800, 800))
plotter.add_mesh(
    triangle_mesh(*mesh2.vertices.T, mesh2.faces),
    scalars=p2[:, :, 0].sum(axis=1),
    show_scalar_bar=False,
)
plotter.add_scalar_bar()
plotter.add_mesh(
    triangle_mesh(*mesh.vertices.T, mesh.faces),
    style="wireframe",
    show_scalar_bar=False,
)
plotter.add_mesh(
    vector_glyphs(*mesh.triangles_center.T, *mesh.face_normals.T), show_scalar_bar=False
)

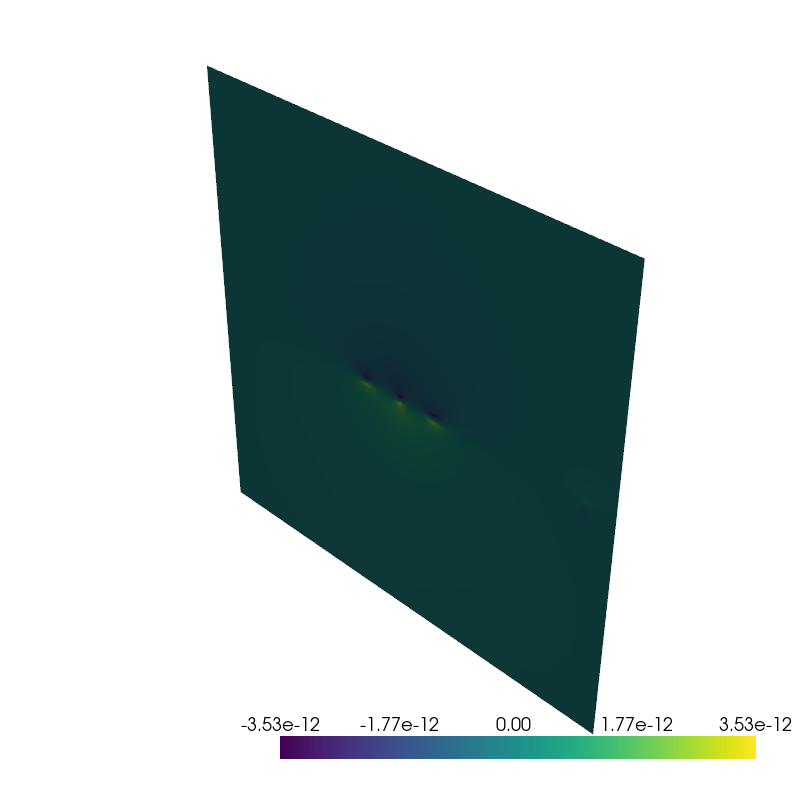
plotter = pv.Plotter(window_size=(800, 800))
plotter.add_mesh(
    triangle_mesh(*mesh2.vertices.T, mesh2.faces),
    scalars=(p1 - p2)[:, :, 0].sum(axis=1),
    show_scalar_bar=False,
)
plotter.add_scalar_bar()
<vtkmodules.vtkRenderingAnnotation.vtkScalarBarActor(0x55979b3a6e80) at 0x7f127a987280>
points = np.zeros((100, 3))
points[:, 2] = np.linspace(-1, 1, 100)
from bfieldtools.legacy.integrals import omega as omega1
from bfieldtools.integrals import omega as omega2

RR = points[:, None, None, :] - mesh.vertices[None, mesh.faces]
o1 = omega1(RR).sum(axis=1)
o2 = omega2(RR).sum(axis=1)

assert np.allclose(o1, -o2)

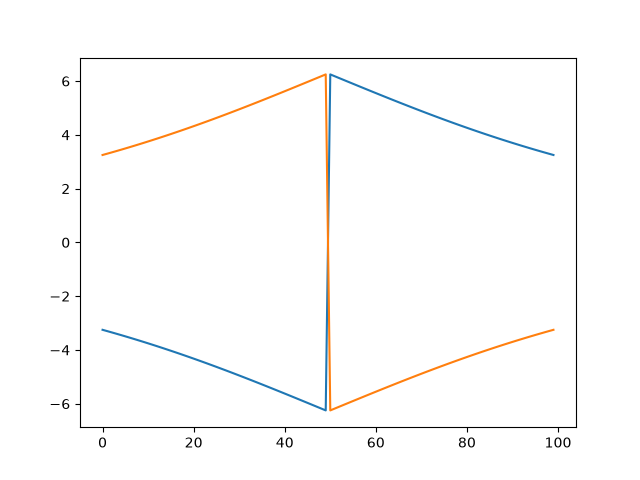
plt.plot(o1)
plt.plot(o2)
plotter.add_mesh(
    polyline(*points.T, points[:, 2]).tube(radius=0.01),
    cmap="seismic",
    show_scalar_bar=False,
)
plotter.add_mesh(
    vector_glyphs(*mesh.triangles_center.T, *mesh.face_normals.T), show_scalar_bar=False
)
Actor (0x7f127a986b00)
  Center:                     (0.0, 0.0, 0.07637625932693481)
  Pickable:                   True
  Position:                   (0.0, 0.0, 0.0)
  Scale:                      (1.0, 1.0, 1.0)
  Visible:                    True
  X Bounds                    -1.015E+00, 1.015E+00
  Y Bounds                    -1.170E+00, 1.170E+00
  Z Bounds                    -1.035E-18, 1.528E-01
  User matrix:                Identity
  Has mapper:                 True

Property (0x7f127b8c9240)
  Ambient:                     0.0
  Ambient color:               Color(name='light_blue', hex='#add8e6ff', opacity=255)
  Anisotropy:                  0.0
  Color:                       Color(name='light_blue', hex='#add8e6ff', opacity=255)
  Culling:                     "none"
  Diffuse:                     1.0
  Diffuse color:               Color(name='light_blue', hex='#add8e6ff', opacity=255)
  Edge color:                  Color(name='black', hex='#000000ff', opacity=255)
  Edge opacity:                1.0
  Interpolation:               InterpolationType.FLAT
  Lighting:                    True
  Line width:                  1.0
  Metallic:                    0.0
  Opacity:                     1.0
  Point size:                  5.0
  Render lines as tubes:       False
  Render points as spheres:    False
  Roughness:                   0.5
  Show edges:                  False
  Specular:                    0.0
  Specular color:              Color(name='light_blue', hex='#add8e6ff', opacity=255)
  Specular power:              100.0
  Style:                       "Surface"

DataSetMapper (0x7f127a8ef4c0)
  Scalar visibility:           True
  Scalar range:                (1.0, 1.0)
  Interpolate before mapping:  True
  Scalar map mode:             point
  Color mode:                  map

Attached dataset:
PolyData (0x7f1298b98220)
  N Cells:    258
  N Points:   606
  N Strips:   0
  X Bounds:   -1.015e+00, 1.015e+00
  Y Bounds:   -1.170e+00, 1.170e+00
  Z Bounds:   -1.035e-18, 1.528e-01
  N Arrays:   2
Plot x_i
from bfieldtools.integrals import x_distance

RR = mesh2.vertices[:, None, None, :] - mesh.vertices[None, mesh.faces]
xdist = x_distance(RR, mesh.face_normals)
plotter.add_mesh(
    triangle_mesh(*mesh2.vertices.T, mesh2.faces),
    scalars=xdist[:, 1, 0],
    cmap="seismic",
    clim=[-1, 1],
    show_scalar_bar=False,
)
plotter.add_scalar_bar()
plotter.add_mesh(
    triangle_mesh(*mesh.vertices.T, mesh.faces),
    style="wireframe",
    show_scalar_bar=False,
)
plotter.add_mesh(
    vector_glyphs(*mesh.triangles_center.T, *mesh.face_normals.T), show_scalar_bar=False
)
Actor (0x7f127b6a5ae0)
  Center:                     (0.0, 0.0, 0.07637625932693481)
  Pickable:                   True
  Position:                   (0.0, 0.0, 0.0)
  Scale:                      (1.0, 1.0, 1.0)
  Visible:                    True
  X Bounds                    -1.015E+00, 1.015E+00
  Y Bounds                    -1.170E+00, 1.170E+00
  Z Bounds                    -1.035E-18, 1.528E-01
  User matrix:                Identity
  Has mapper:                 True

Property (0x7f127b14fee0)
  Ambient:                     0.0
  Ambient color:               Color(name='light_blue', hex='#add8e6ff', opacity=255)
  Anisotropy:                  0.0
  Color:                       Color(name='light_blue', hex='#add8e6ff', opacity=255)
  Culling:                     "none"
  Diffuse:                     1.0
  Diffuse color:               Color(name='light_blue', hex='#add8e6ff', opacity=255)
  Edge color:                  Color(name='black', hex='#000000ff', opacity=255)
  Edge opacity:                1.0
  Interpolation:               InterpolationType.FLAT
  Lighting:                    True
  Line width:                  1.0
  Metallic:                    0.0
  Opacity:                     1.0
  Point size:                  5.0
  Render lines as tubes:       False
  Render points as spheres:    False
  Roughness:                   0.5
  Show edges:                  False
  Specular:                    0.0
  Specular color:              Color(name='light_blue', hex='#add8e6ff', opacity=255)
  Specular power:              100.0
  Style:                       "Surface"

DataSetMapper (0x7f127b14d300)
  Scalar visibility:           True
  Scalar range:                (1.0, 1.0)
  Interpolate before mapping:  True
  Scalar map mode:             point
  Color mode:                  map

Attached dataset:
PolyData (0x7f127b14efe0)
  N Cells:    258
  N Points:   606
  N Strips:   0
  X Bounds:   -1.015e+00, 1.015e+00
  Y Bounds:   -1.170e+00, 1.170e+00
  Z Bounds:   -1.035e-18, 1.528e-01
  N Arrays:   2
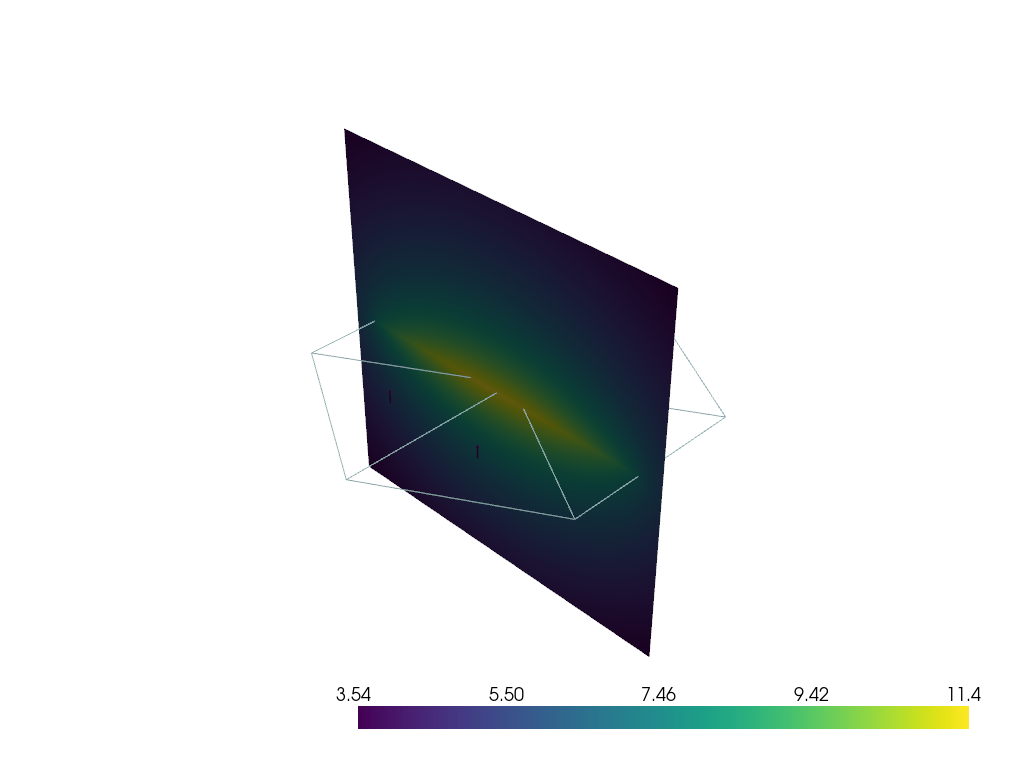
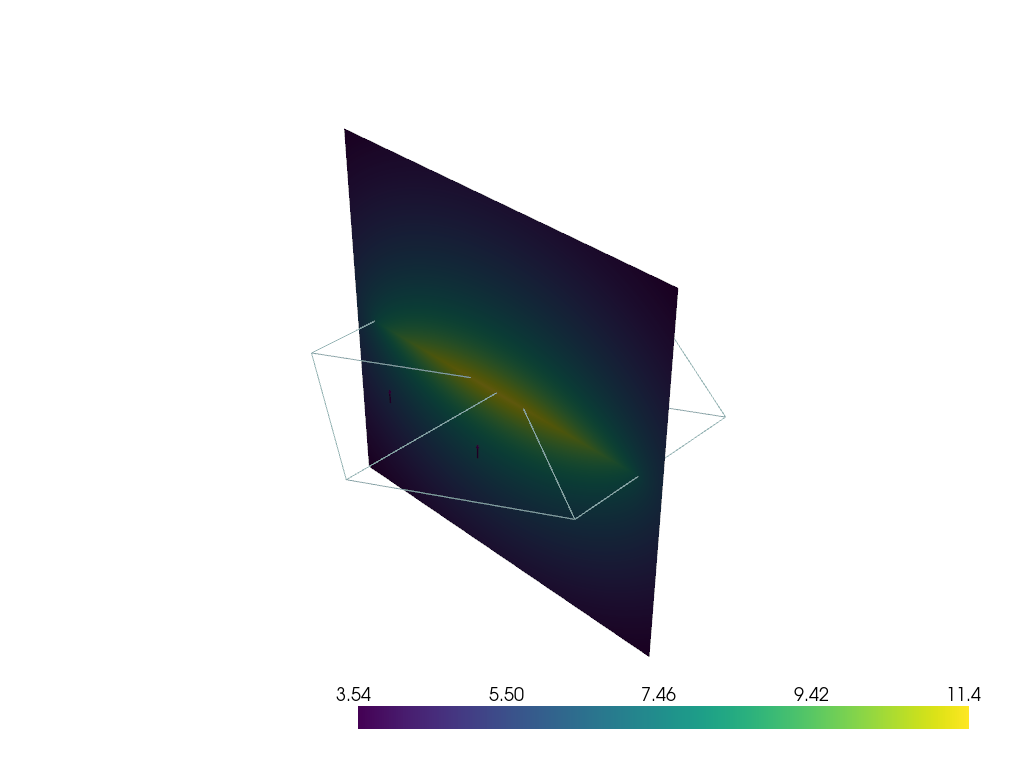
Uniform charge density
from bfieldtools.legacy.integrals import triangle_potential_uniform as u1
from bfieldtools.integrals import triangle_potential_uniform as u2

RR = mesh2.vertices[:, None, None, :] - mesh.vertices[None, mesh.faces]
p1 = u1(RR, mesh.face_normals, planar=False)
p2 = u2(RR, mesh.face_normals, planar=False)

assert np.allclose(p1, p2)


plotter = pv.Plotter()
plotter.add_mesh(
    triangle_mesh(*mesh2.vertices.T, mesh2.faces),
    scalars=p1.sum(axis=1),
    show_scalar_bar=False,
)
plotter.add_scalar_bar()
plotter.add_mesh(
    triangle_mesh(*mesh.vertices.T, mesh.faces),
    style="wireframe",
    show_scalar_bar=False,
)
plotter.add_mesh(
    vector_glyphs(*mesh.triangles_center.T, *mesh.face_normals.T), show_scalar_bar=False
)
plotter = pv.Plotter()
plotter.add_mesh(
    triangle_mesh(*mesh2.vertices.T, mesh2.faces),
    scalars=p2.sum(axis=1),
    show_scalar_bar=False,
)
plotter.add_scalar_bar()
plotter.add_mesh(
    triangle_mesh(*mesh.vertices.T, mesh.faces),
    style="wireframe",
    show_scalar_bar=False,
)
plotter.add_mesh(
    vector_glyphs(*mesh.triangles_center.T, *mesh.face_normals.T), show_scalar_bar=False
)
Actor (0x7f12798f96c0)
  Center:                     (0.0, 0.0, 0.07637625932693481)
  Pickable:                   True
  Position:                   (0.0, 0.0, 0.0)
  Scale:                      (1.0, 1.0, 1.0)
  Visible:                    True
  X Bounds                    -1.015E+00, 1.015E+00
  Y Bounds                    -1.170E+00, 1.170E+00
  Z Bounds                    -1.035E-18, 1.528E-01
  User matrix:                Identity
  Has mapper:                 True

Property (0x7f12995eeda0)
  Ambient:                     0.0
  Ambient color:               Color(name='light_blue', hex='#add8e6ff', opacity=255)
  Anisotropy:                  0.0
  Color:                       Color(name='light_blue', hex='#add8e6ff', opacity=255)
  Culling:                     "none"
  Diffuse:                     1.0
  Diffuse color:               Color(name='light_blue', hex='#add8e6ff', opacity=255)
  Edge color:                  Color(name='black', hex='#000000ff', opacity=255)
  Edge opacity:                1.0
  Interpolation:               InterpolationType.FLAT
  Lighting:                    True
  Line width:                  1.0
  Metallic:                    0.0
  Opacity:                     1.0
  Point size:                  5.0
  Render lines as tubes:       False
  Render points as spheres:    False
  Roughness:                   0.5
  Show edges:                  False
  Specular:                    0.0
  Specular color:              Color(name='light_blue', hex='#add8e6ff', opacity=255)
  Specular power:              100.0
  Style:                       "Surface"

DataSetMapper (0x7f12995eeda0)
  Scalar visibility:           True
  Scalar range:                (1.0, 1.0)
  Interpolate before mapping:  True
  Scalar map mode:             point
  Color mode:                  map

Attached dataset:
PolyData (0x7f127b8cb280)
  N Cells:    258
  N Points:   606
  N Strips:   0
  X Bounds:   -1.015e+00, 1.015e+00
  Y Bounds:   -1.170e+00, 1.170e+00
  Z Bounds:   -1.035e-18, 1.528e-01
  N Arrays:   2
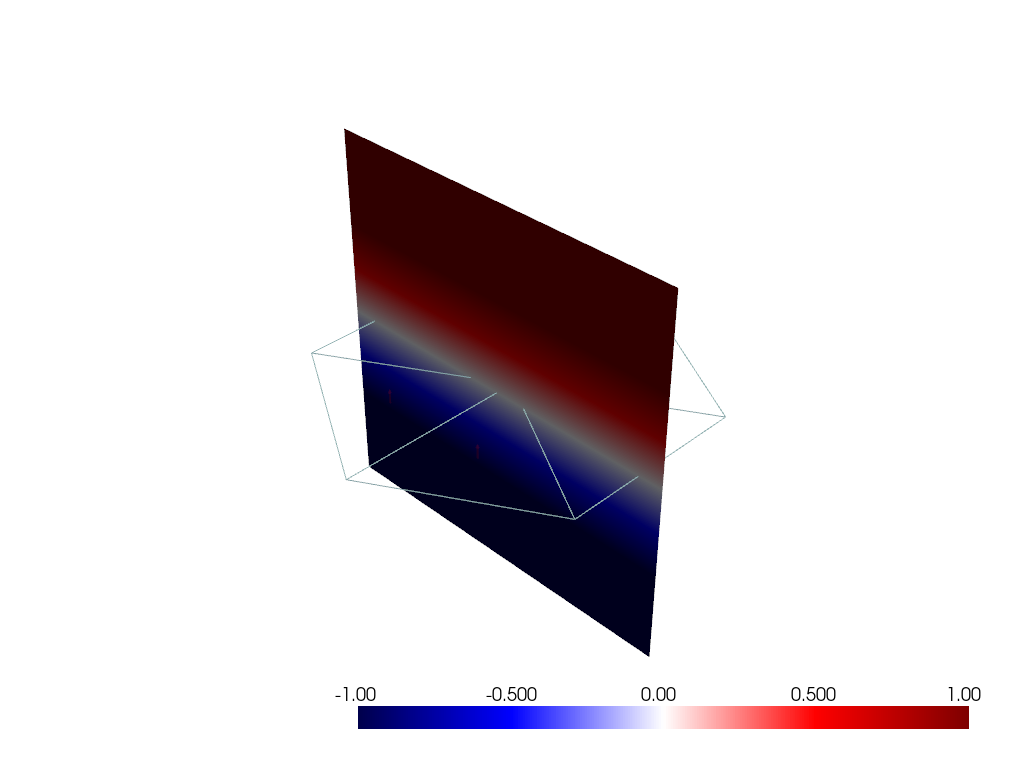
from bfieldtools.integrals import d_distance

RR = mesh2.vertices[:, None, None, :] - mesh.vertices[None, mesh.faces]
ddist = d_distance(RR, mesh.face_normals)
plotter = pv.Plotter()
plotter.add_mesh(
    triangle_mesh(*mesh2.vertices.T, mesh2.faces),
    scalars=ddist[:, 0],
    cmap="seismic",
    clim=[-1, 1],
    show_scalar_bar=False,
)
plotter.add_scalar_bar()
plotter.add_mesh(
    triangle_mesh(*mesh.vertices.T, mesh.faces),
    style="wireframe",
    show_scalar_bar=False,
)
plotter.add_mesh(
    vector_glyphs(*mesh.triangles_center.T, *mesh.face_normals.T), show_scalar_bar=False
)
Actor (0x7f127ca30f40)
  Center:                     (0.0, 0.0, 0.07637625932693481)
  Pickable:                   True
  Position:                   (0.0, 0.0, 0.0)
  Scale:                      (1.0, 1.0, 1.0)
  Visible:                    True
  X Bounds                    -1.015E+00, 1.015E+00
  Y Bounds                    -1.170E+00, 1.170E+00
  Z Bounds                    -1.035E-18, 1.528E-01
  User matrix:                Identity
  Has mapper:                 True

Property (0x7f127ca30ca0)
  Ambient:                     0.0
  Ambient color:               Color(name='light_blue', hex='#add8e6ff', opacity=255)
  Anisotropy:                  0.0
  Color:                       Color(name='light_blue', hex='#add8e6ff', opacity=255)
  Culling:                     "none"
  Diffuse:                     1.0
  Diffuse color:               Color(name='light_blue', hex='#add8e6ff', opacity=255)
  Edge color:                  Color(name='black', hex='#000000ff', opacity=255)
  Edge opacity:                1.0
  Interpolation:               InterpolationType.FLAT
  Lighting:                    True
  Line width:                  1.0
  Metallic:                    0.0
  Opacity:                     1.0
  Point size:                  5.0
  Render lines as tubes:       False
  Render points as spheres:    False
  Roughness:                   0.5
  Show edges:                  False
  Specular:                    0.0
  Specular color:              Color(name='light_blue', hex='#add8e6ff', opacity=255)
  Specular power:              100.0
  Style:                       "Surface"

DataSetMapper (0x7f127ca30ca0)
  Scalar visibility:           True
  Scalar range:                (1.0, 1.0)
  Interpolate before mapping:  True
  Scalar map mode:             point
  Color mode:                  map

Attached dataset:
PolyData (0x7f12798fb280)
  N Cells:    258
  N Points:   606
  N Strips:   0
  X Bounds:   -1.015e+00, 1.015e+00
  Y Bounds:   -1.170e+00, 1.170e+00
  Z Bounds:   -1.035e-18, 1.528e-01
  N Arrays:   2
from bfieldtools.legacy.mesh_magnetics import (
    magnetic_field_coupling_analytic as magnetic_field_coupling_analytic_old,
)
from bfieldtools.mesh_magnetics import magnetic_field_coupling_analytic

b1 = magnetic_field_coupling_analytic_old(mesh, mesh2.vertices)
b2 = magnetic_field_coupling_analytic(mesh, mesh2.vertices)

assert np.allclose(b1, b2)

plotter = pv.Plotter()
plotter.add_mesh(
    vector_glyphs(*mesh2.vertices.T, *b1[:, :, 0].T), show_scalar_bar=False
)
plotter.add_mesh(
    vector_glyphs(*mesh2.vertices.T, *b2[:, :, 0].T), show_scalar_bar=False
)
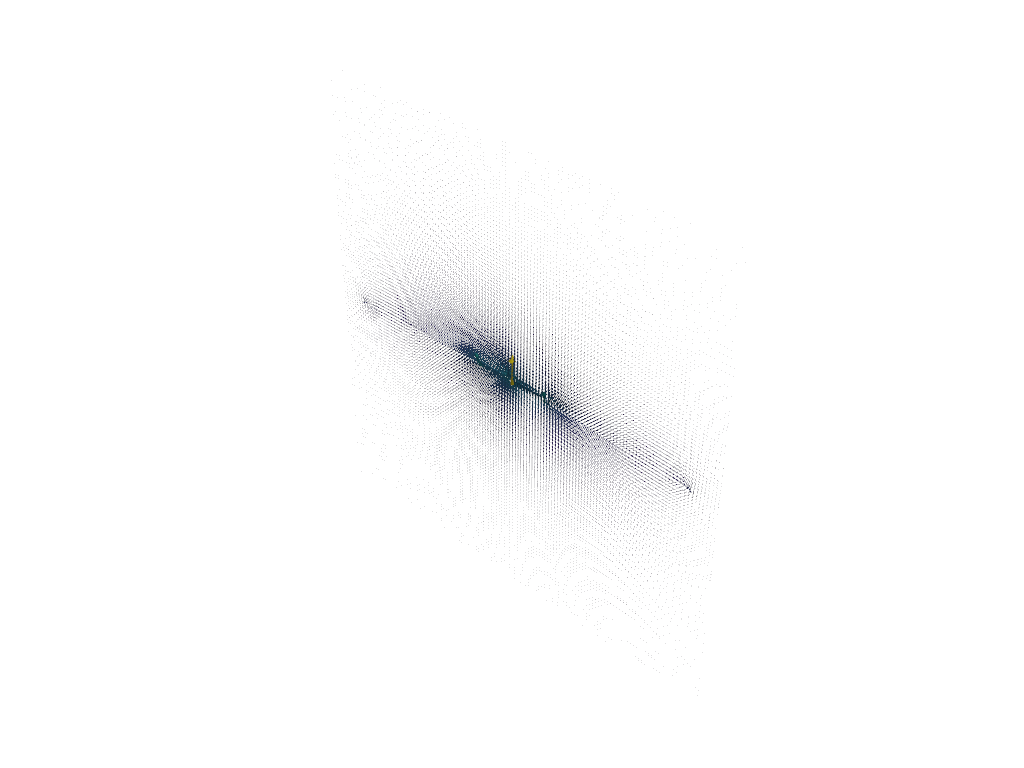
Computing magnetic field coupling matrix analytically, 7 vertices by 16641 target points... took 0.09 seconds.
Computing magnetic field coupling matrix analytically, 7 vertices by 16641 target points... took 0.08 seconds.

Actor (0x7f127ca323e0)
  Center:                     (0.2029091864824295, 0.0, 0.0028907060623168945)
  Pickable:                   True
  Position:                   (0.0, 0.0, 0.0)
  Scale:                      (1.0, 1.0, 1.0)
  Visible:                    True
  X Bounds                    1.637E-01, 2.421E-01
  Y Bounds                    -2.008E+00, 2.008E+00
  Z Bounds                    -2.000E+00, 2.006E+00
  User matrix:                Identity
  Has mapper:                 True

Property (0x7f12a9726020)
  Ambient:                     0.0
  Ambient color:               Color(name='light_blue', hex='#add8e6ff', opacity=255)
  Anisotropy:                  0.0
  Color:                       Color(name='light_blue', hex='#add8e6ff', opacity=255)
  Culling:                     "none"
  Diffuse:                     1.0
  Diffuse color:               Color(name='light_blue', hex='#add8e6ff', opacity=255)
  Edge color:                  Color(name='black', hex='#000000ff', opacity=255)
  Edge opacity:                1.0
  Interpolation:               InterpolationType.FLAT
  Lighting:                    True
  Line width:                  1.0
  Metallic:                    0.0
  Opacity:                     1.0
  Point size:                  5.0
  Render lines as tubes:       False
  Render points as spheres:    False
  Roughness:                   0.5
  Show edges:                  False
  Specular:                    0.0
  Specular color:              Color(name='light_blue', hex='#add8e6ff', opacity=255)
  Specular power:              100.0
  Style:                       "Surface"

DataSetMapper (0x7f12a9726020)
  Scalar visibility:           True
  Scalar range:                (2.268676801975289e-08, 2.3241000235429965e-06)
  Interpolate before mapping:  True
  Scalar map mode:             point
  Color mode:                  map

Attached dataset:
PolyData (0x7f127ca33ee0)
  N Cells:    715563
  N Points:   1680741
  N Strips:   0
  X Bounds:   1.637e-01, 2.421e-01
  Y Bounds:   -2.008e+00, 2.008e+00
  Z Bounds:   -2.000e+00, 2.006e+00
  N Arrays:   2
Gammma
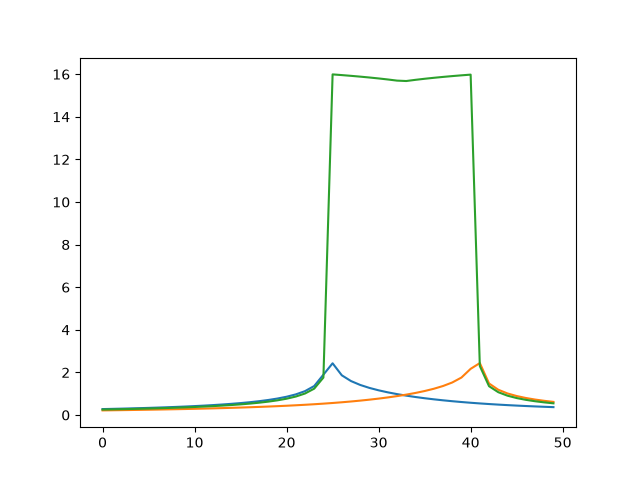
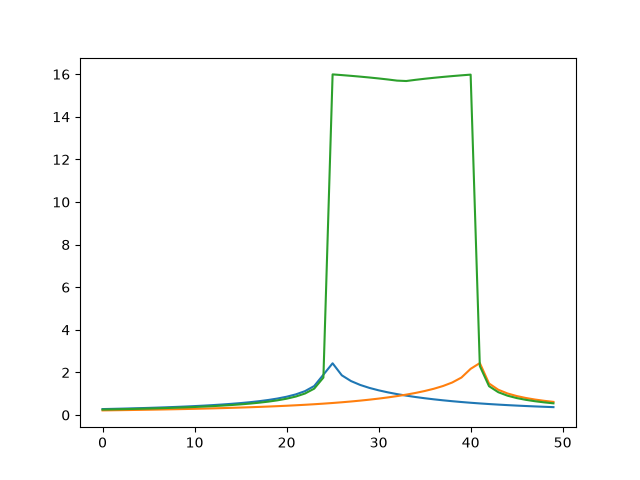
from bfieldtools.legacy.integrals import gamma0 as g1
from bfieldtools.integrals import gamma0 as g2

# RR =  mesh2.vertices[:, None, None, :] - mesh.vertices[None, mesh.faces]
t = np.linspace(-1.5, 1.5)
points = (
    t[:, None] * mesh.vertices[mesh.faces][0][0]
    + (1 - t)[:, None] * mesh.vertices[mesh.faces][0][1]
)


R = points[:, None, None, :] - mesh.vertices[None, mesh.faces]
p1 = g1(R, symmetrize=True)
p2 = g2(R, symmetrize=True)

assert np.allclose(p1, p2)

plt.figure()
plt.plot(p1[:, 0, :])
plt.figure()
plt.plot(p2[:, 0, :])

# Display the assembled scene (Sphinx-Gallery captures it during docs builds).
if "plotter" in globals() and not plotter._closed:
    plotter.show()
Total running time of the script: (0 minutes 12.061 seconds)