Note
Click here to download the full example code
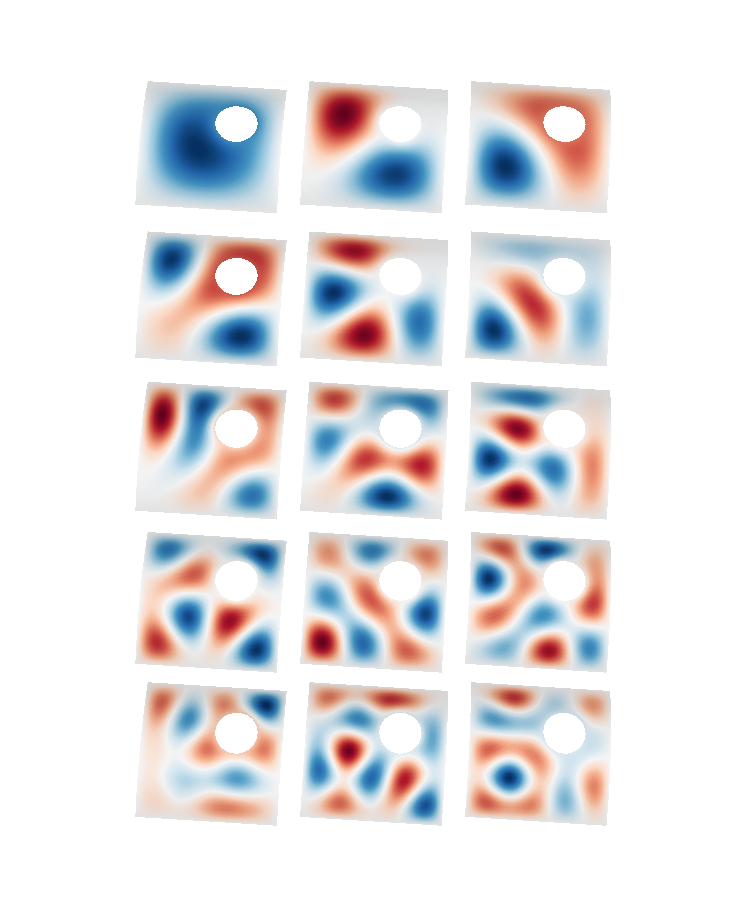
Figure 2: Surface harmonics modes
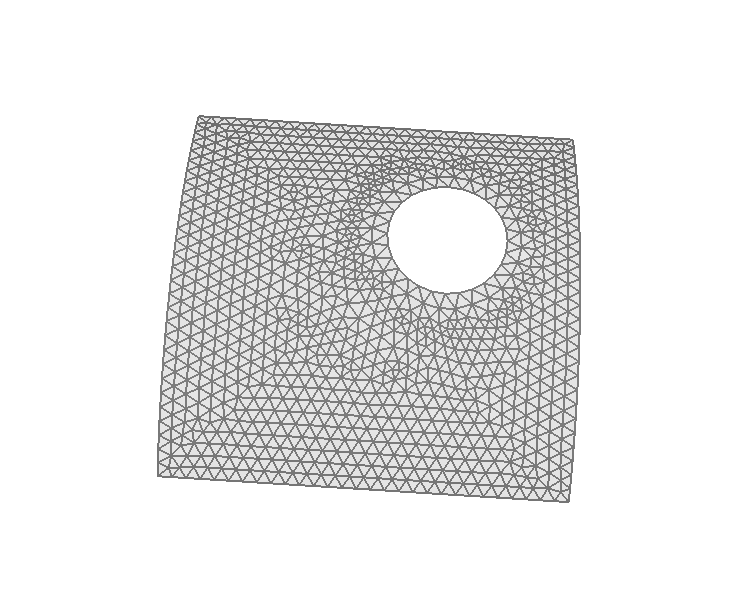
First 15 surface harmonics of a triangle mesh. The index (and spatial frequency) increases from left to right, row by row. The hole and outer boundary have zero tangential derivative. The mesh discretization is shown in the magnified inset to the right.
Out:
Calculating surface harmonics expansion...
Computing the laplacian matrix...
Computing the mass matrix...
0 0
1 0
2 0
0 1
1 1
2 1
0 2
1 2
2 2
0 3
1 3
2 3
0 4
1 4
2 4
from bfieldtools.mesh_conductor import MeshConductor

import numpy as np

SAVE = False
SAVE_DIR = "./Surface harmonics/"


c = MeshConductor(
    mesh_file=SAVE_DIR + "arbitrary_surface.stl",
    process=True,
    basis_name="suh",
    N_suh=15,
    fix_normals=True,
)


T_x = 1.5 * np.pi / 2
T_z = -1.02 * np.pi
rotmat = np.array(
    [
        [np.cos(T_z), -np.sin(T_z), 0, 0],
        [np.sin(T_z), np.cos(T_z), 0, 0],
        [0, 0, 1, 0],
        [0, 0, 0, 1],
    ]
) @ np.array(
    [
        [1, 0, 0, 0],
        [0, np.cos(T_x), -np.sin(T_x), 0],
        [0, np.sin(T_x), np.cos(T_x), 0],
        [0, 0, 0, 1],
    ]
)


c.mesh.apply_transform(rotmat)


from mayavi import mlab
from mayavi.api import Engine

e = Engine()
e.start()


f = mlab.figure(None, bgcolor=(1, 1, 1), fgcolor=(0.5, 0.5, 0.5), size=(750, 900))

surfaces = c.suh_basis.plot(
    Nfuncs=c.basis.shape[1], Ncols=2, dist=0.1, colormap="RdBu", figure=f, ncolors=256
)

f.scene.z_plus_view()
1 + 1
#
for idx, surface in enumerate(surfaces):
    surface.actor.mapper.interpolate_scalars_before_mapping = True
    surface.module_manager.scalar_lut_manager.data_range = np.array(
        [
            -np.max(np.abs(c.suh_basis.basis[:, idx])),
            np.max(np.abs(c.suh_basis.basis[:, idx])),
        ]
    )


# f.scene.camera.parallel_projection=1
# mlab.view(0,160)
f.scene.camera.zoom(1.2)
# f.scene.camera.roll(270)

if SAVE:
    mlab.savefig(
        SAVE_DIR + "surface_harmonics.png", figure=f, magnification=4,
    )

    mlab.close()

f = mlab.figure(None, bgcolor=(1, 1, 1), fgcolor=(0.5, 0.5, 0.5), size=(750, 600))

c.plot_mesh(representation="wireframe", figure=f)
c.plot_mesh(opacity=0.2, figure=f)
#
# f.scene.camera.parallel_projection=1
# mlab.view(0,160)
f.scene.camera.zoom(1.5)
f.scene.z_plus_view()
# f.scene.camera.roll(270)

if SAVE:
    mlab.savefig(
        SAVE_DIR + "suhmesh.png", figure=f, magnification=6,
    )
    mlab.close()
Total running time of the script: ( 0 minutes 1.400 seconds)
Estimated memory usage: 29 MB